My Journey on Analog IC Design
This page is still under construction. This work is done by me and Makkawan Lohitsiri.
This work utilizes SKY130 PDK. Aims to verify the result from this paper:
The paper: P. -H. Hsieh, J. Maxey and C. -K. K. Yang, “Minimizing the Supply Sensitivity of a CMOS Ring Oscillator Through Jointly Biasing the Supply and Control Voltages,” in IEEE Journal of Solid-State Circuits, vol. 44, no. 9, pp. 2488-2495, Sept. 2009, doi: 10.1109/JSSC.2009.2025406.
Firstly, follow this video (link) to install things on Windows (I use the packaged PDK from iic-osic)
A simple 7-stage VCO can be made on xschem.
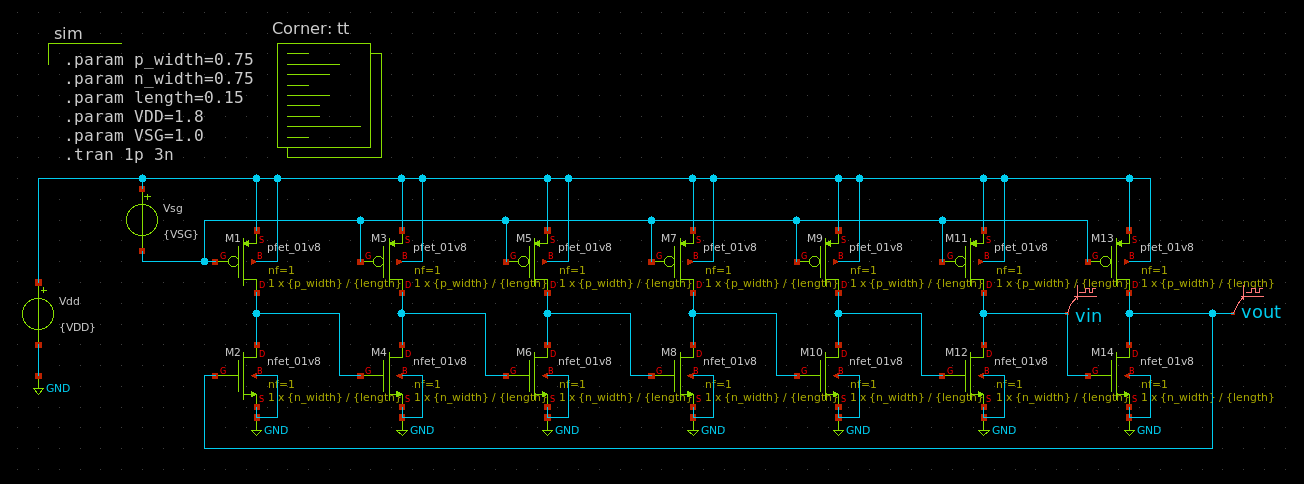
To make things easier, you can automate frequency measuring by using Python with the pyspice package. (Given that xschem uses ngspice to simulate the circuit.)
# Code for Generating Plot Between
# Oscillator Frequency vs. VDS at various VSG.
#
# 20 May 2023.
#
# By Nutchanon Jariyanurut and Makkawan Lohitsiri.

# Import required packages.
import PySpice.Logging.Logging as Logging
from PySpice.Spice.NgSpice.Shared import NgSpiceShared
from matplotlib import pyplot as plt
import numpy as np
import pandas as pd

# Setting the logger.
logger = Logging.setup_logging()

# Read the SPICE file.
f = open("vco_simple.spice","r")
lines = f.readlines()

# List of corners.
corner_list = ["tt","ff","ss","sf","fs"]

for corner in corner_list:

    # Zero padding for column data.
    k = 0

    # DataFrame to keep all data.
    df = pd.DataFrame()

    # VSG range from 0.8 to 1.7 V.
    VSG_list = np.arange(0.8, 1.79, 0.1)

    for VSG in VSG_list:

        # Each VSG has VDD in the range of (VSG - 4) to VDD.
        VDD_list = np.arange(VSG - 0.4, 1.79, 0.02)

        # Keeping frequency at each VDD but same VSG.
        freq_list = []

        for VDD in VDD_list:

            # Initiate ngspice.
            ngspice = NgSpiceShared.new_instance()

            # Change the SPICE file to each corresponding experiment.
            circuit = ""
            for line in lines:
                if ".param VSG=" in line:
                    line = f".param VSG={VSG:.2f}\n"
                if ".param VDD=" in line:
                    line = f".param VDD={VDD:.2f}\n"
                if "corners/tt" in line:
                    line = line.replace("corners/tt", f"corners/{corner}")
                    print(line)
                circuit = "".join([circuit, line])

            # Load the SPICE file to ngspice.
            ngspice.load_circuit(circuit)

            # Run the simulation.
            ngspice.run()

            # Pull the experiment.
            plot = ngspice.plot(simulation=None, plot_name=ngspice.last_plot)

            # Pull the waveforms.
            analysis = plot.to_analysis()

            # Change the waveforms to NumPy array.
            v_in = np.array(analysis.vin)
            v_out = np.array(analysis.vout)
            v_time = np.array(analysis.vout.abscissa)

            # Time-series plot.
            plt.figure()
            plt.plot(v_time, v_in, label="V_in")
            plt.plot(v_time, v_out, label="V_out")
            plt.title(f"V_in and V_out waveforms vs. time\n when VDD={VDD:.2f} V and VSG={VSG:.2f} V")
            plt.xlabel("time (s)")
            plt.ylabel("voltage (V)")
            plt.legend(bbox_to_anchor=(1.04, 0), loc="lower left", borderaxespad=0)
            plt.savefig(f"osc_VSG={VSG:.2f}_VDD={VDD:.2f}.png", format="png", dpi=300, bbox_inches = 'tight')
            plt.close()

            # Calculate.
            v_max = (np.max(v_in) + np.max(v_out))/2
            v_min = (np.min(v_in) + np.min(v_out))/2
            v_avg = (v_max + v_min)/2
            v_in_norm = v_in - v_avg
            v_out_norm = v_out - v_avg

            try:
                # If the waveform has not less than 1 period per simulation time, this can be run.
                zero_crossing_times = v_time[np.where(np.diff(np.sign(v_out_norm)))]
                period = zero_crossing_times[-1] - zero_crossing_times[-3]

                freq = 1/period
                print(f"VSG={VSG:.2f}_VDD={VDD:.2f}")
                print(freq)
            except:
                # If the waveform has less than 1 period per simulation time.
                freq = 0

            # Save data.
            freq_list.append(freq)

            # Delete data in ngspice to prevent memory leakage.
            # (But memory leakage is still exist, anyway, so, please beware of OOM-killer in Linux.)
            ngspice.exec_command("destroy all")
            ngspice.exec_command("reset")

        # Save data to df.
        # the row is started from (VSG(min) - 4) to VDD.
        data_column = np.concatenate((np.zeros(k), freq_list))
        df[f"VSG={VSG:.2f}"] = data_column

        # change zero padding for column data.
        k += 5

    # Save df to csv.
    df.to_csv(f"freq_osc_corner={corner}.csv", encoding='utf-8')

# After the csv is generated, data cleaning (manually) is required.
Then, the CSV file can be cleaned and plotted in a corresponding manner to get:
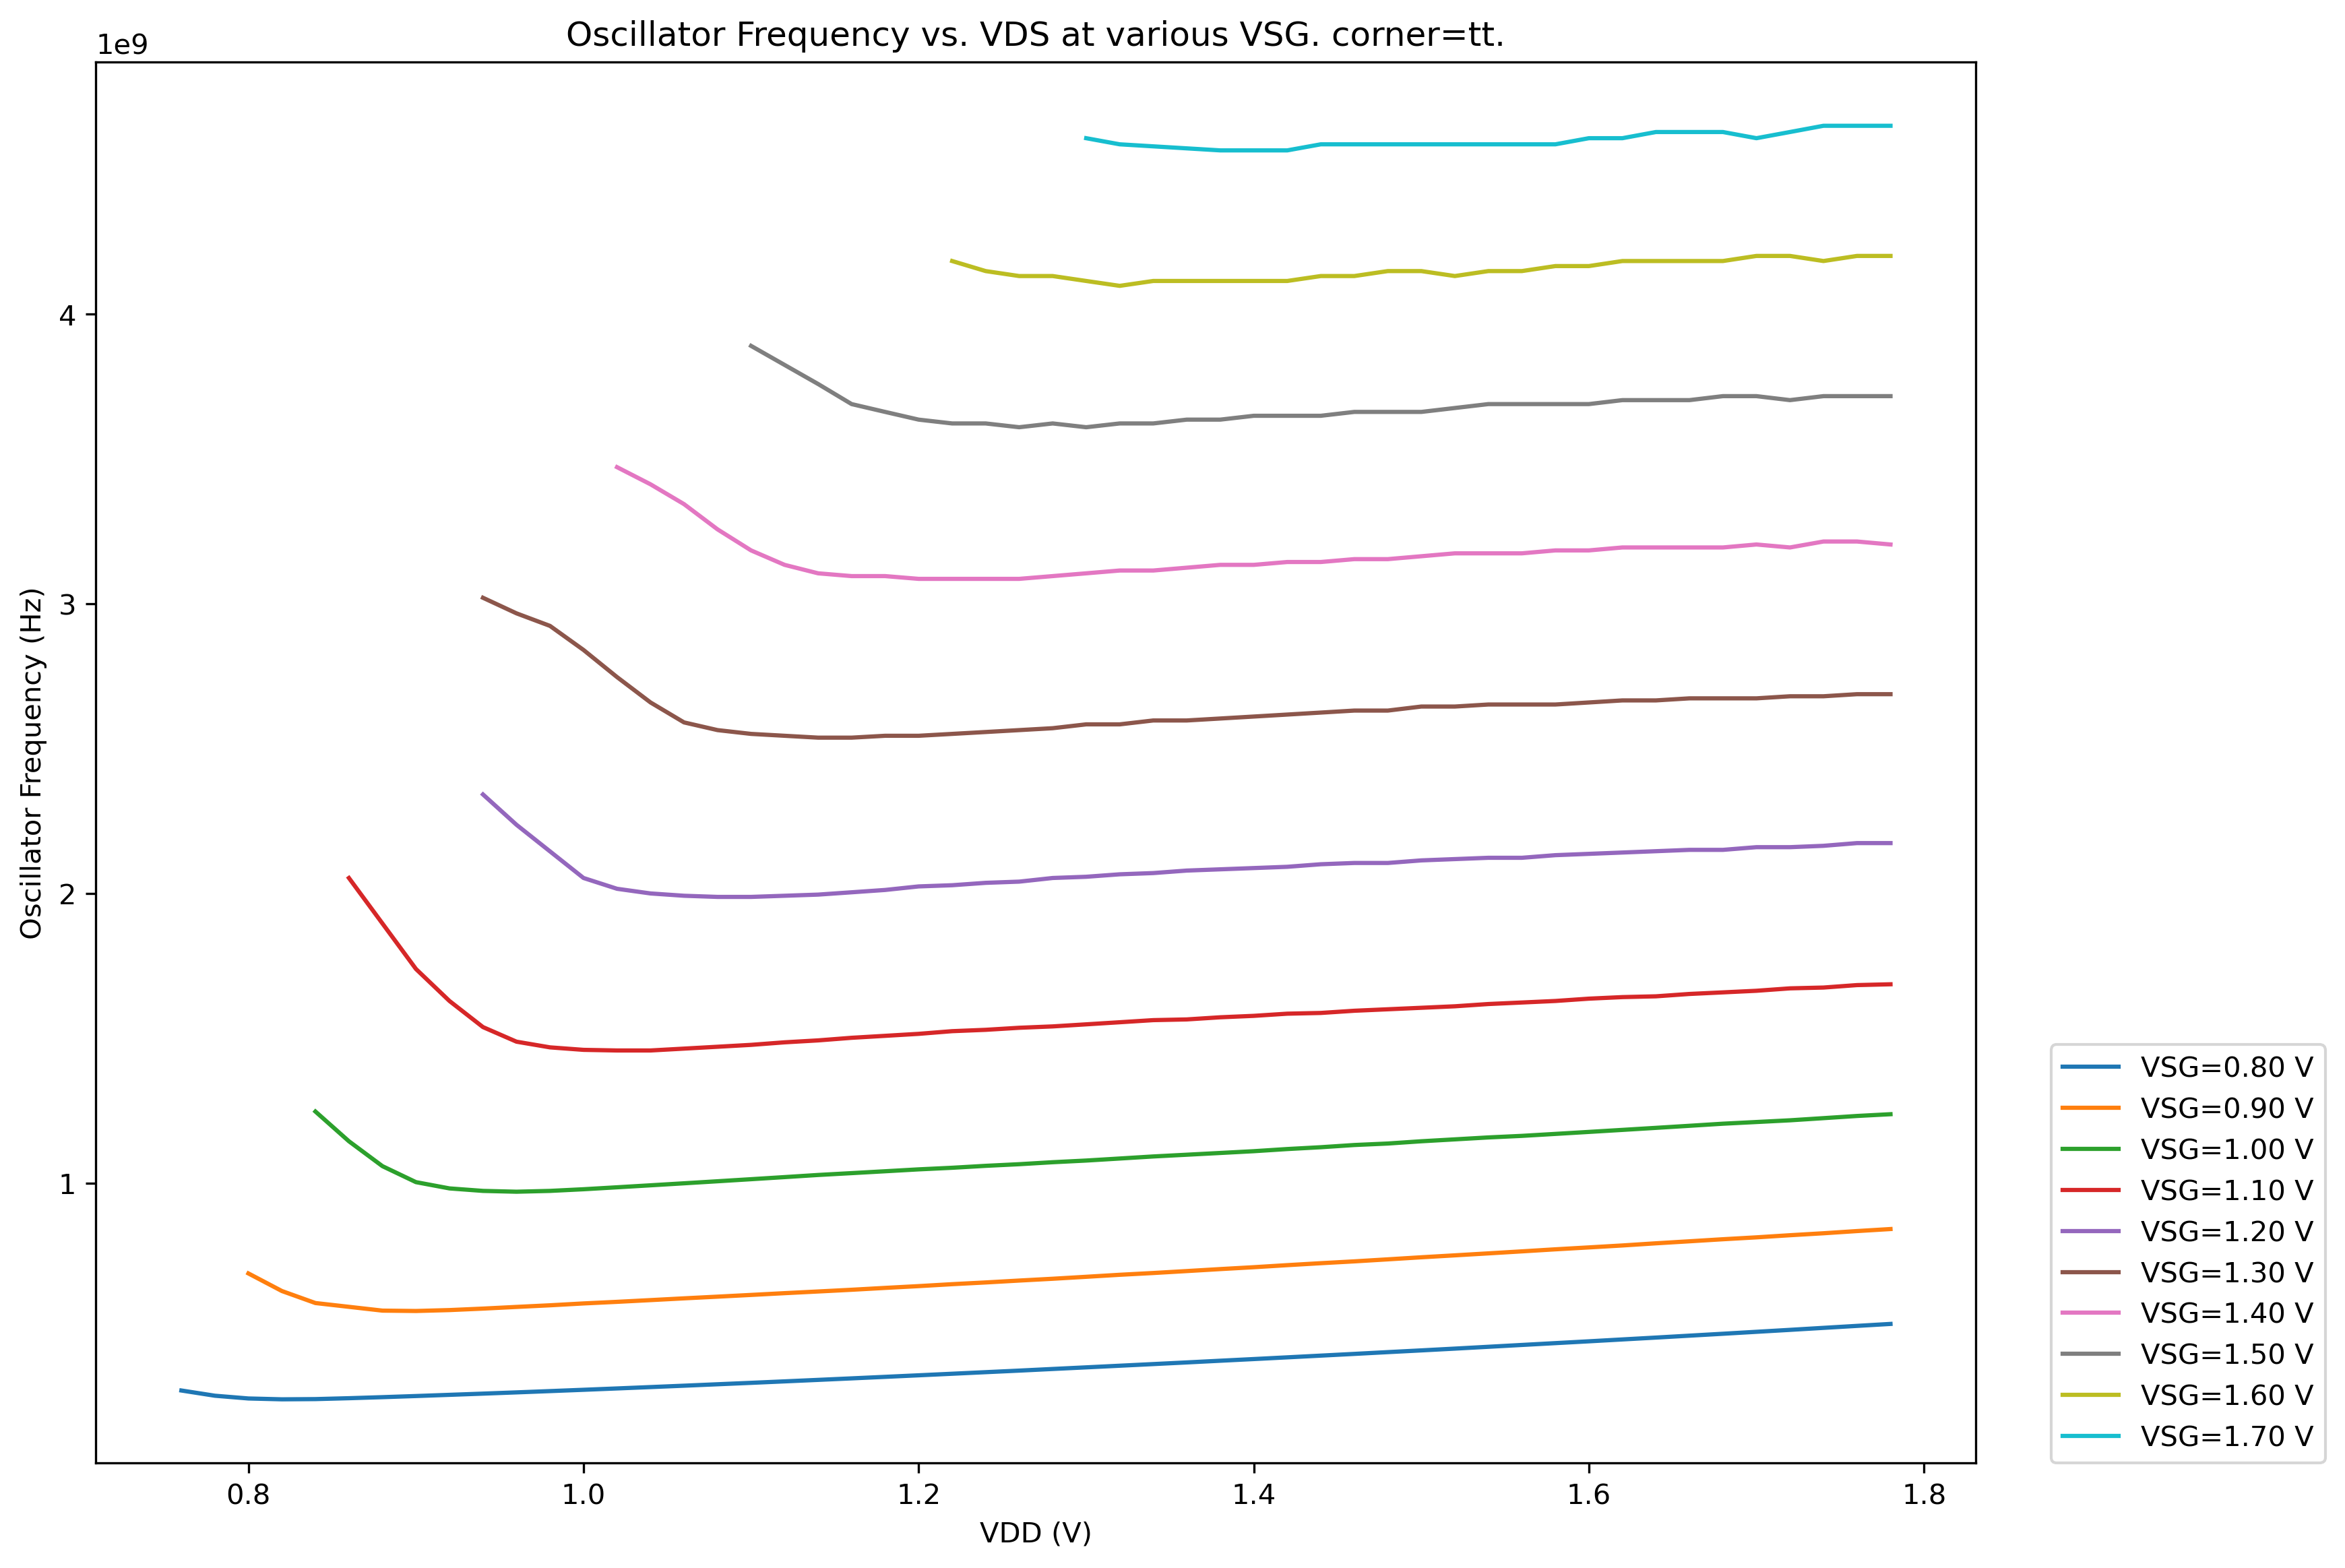
Some data manipulation by Python will get the lowest points from each line.
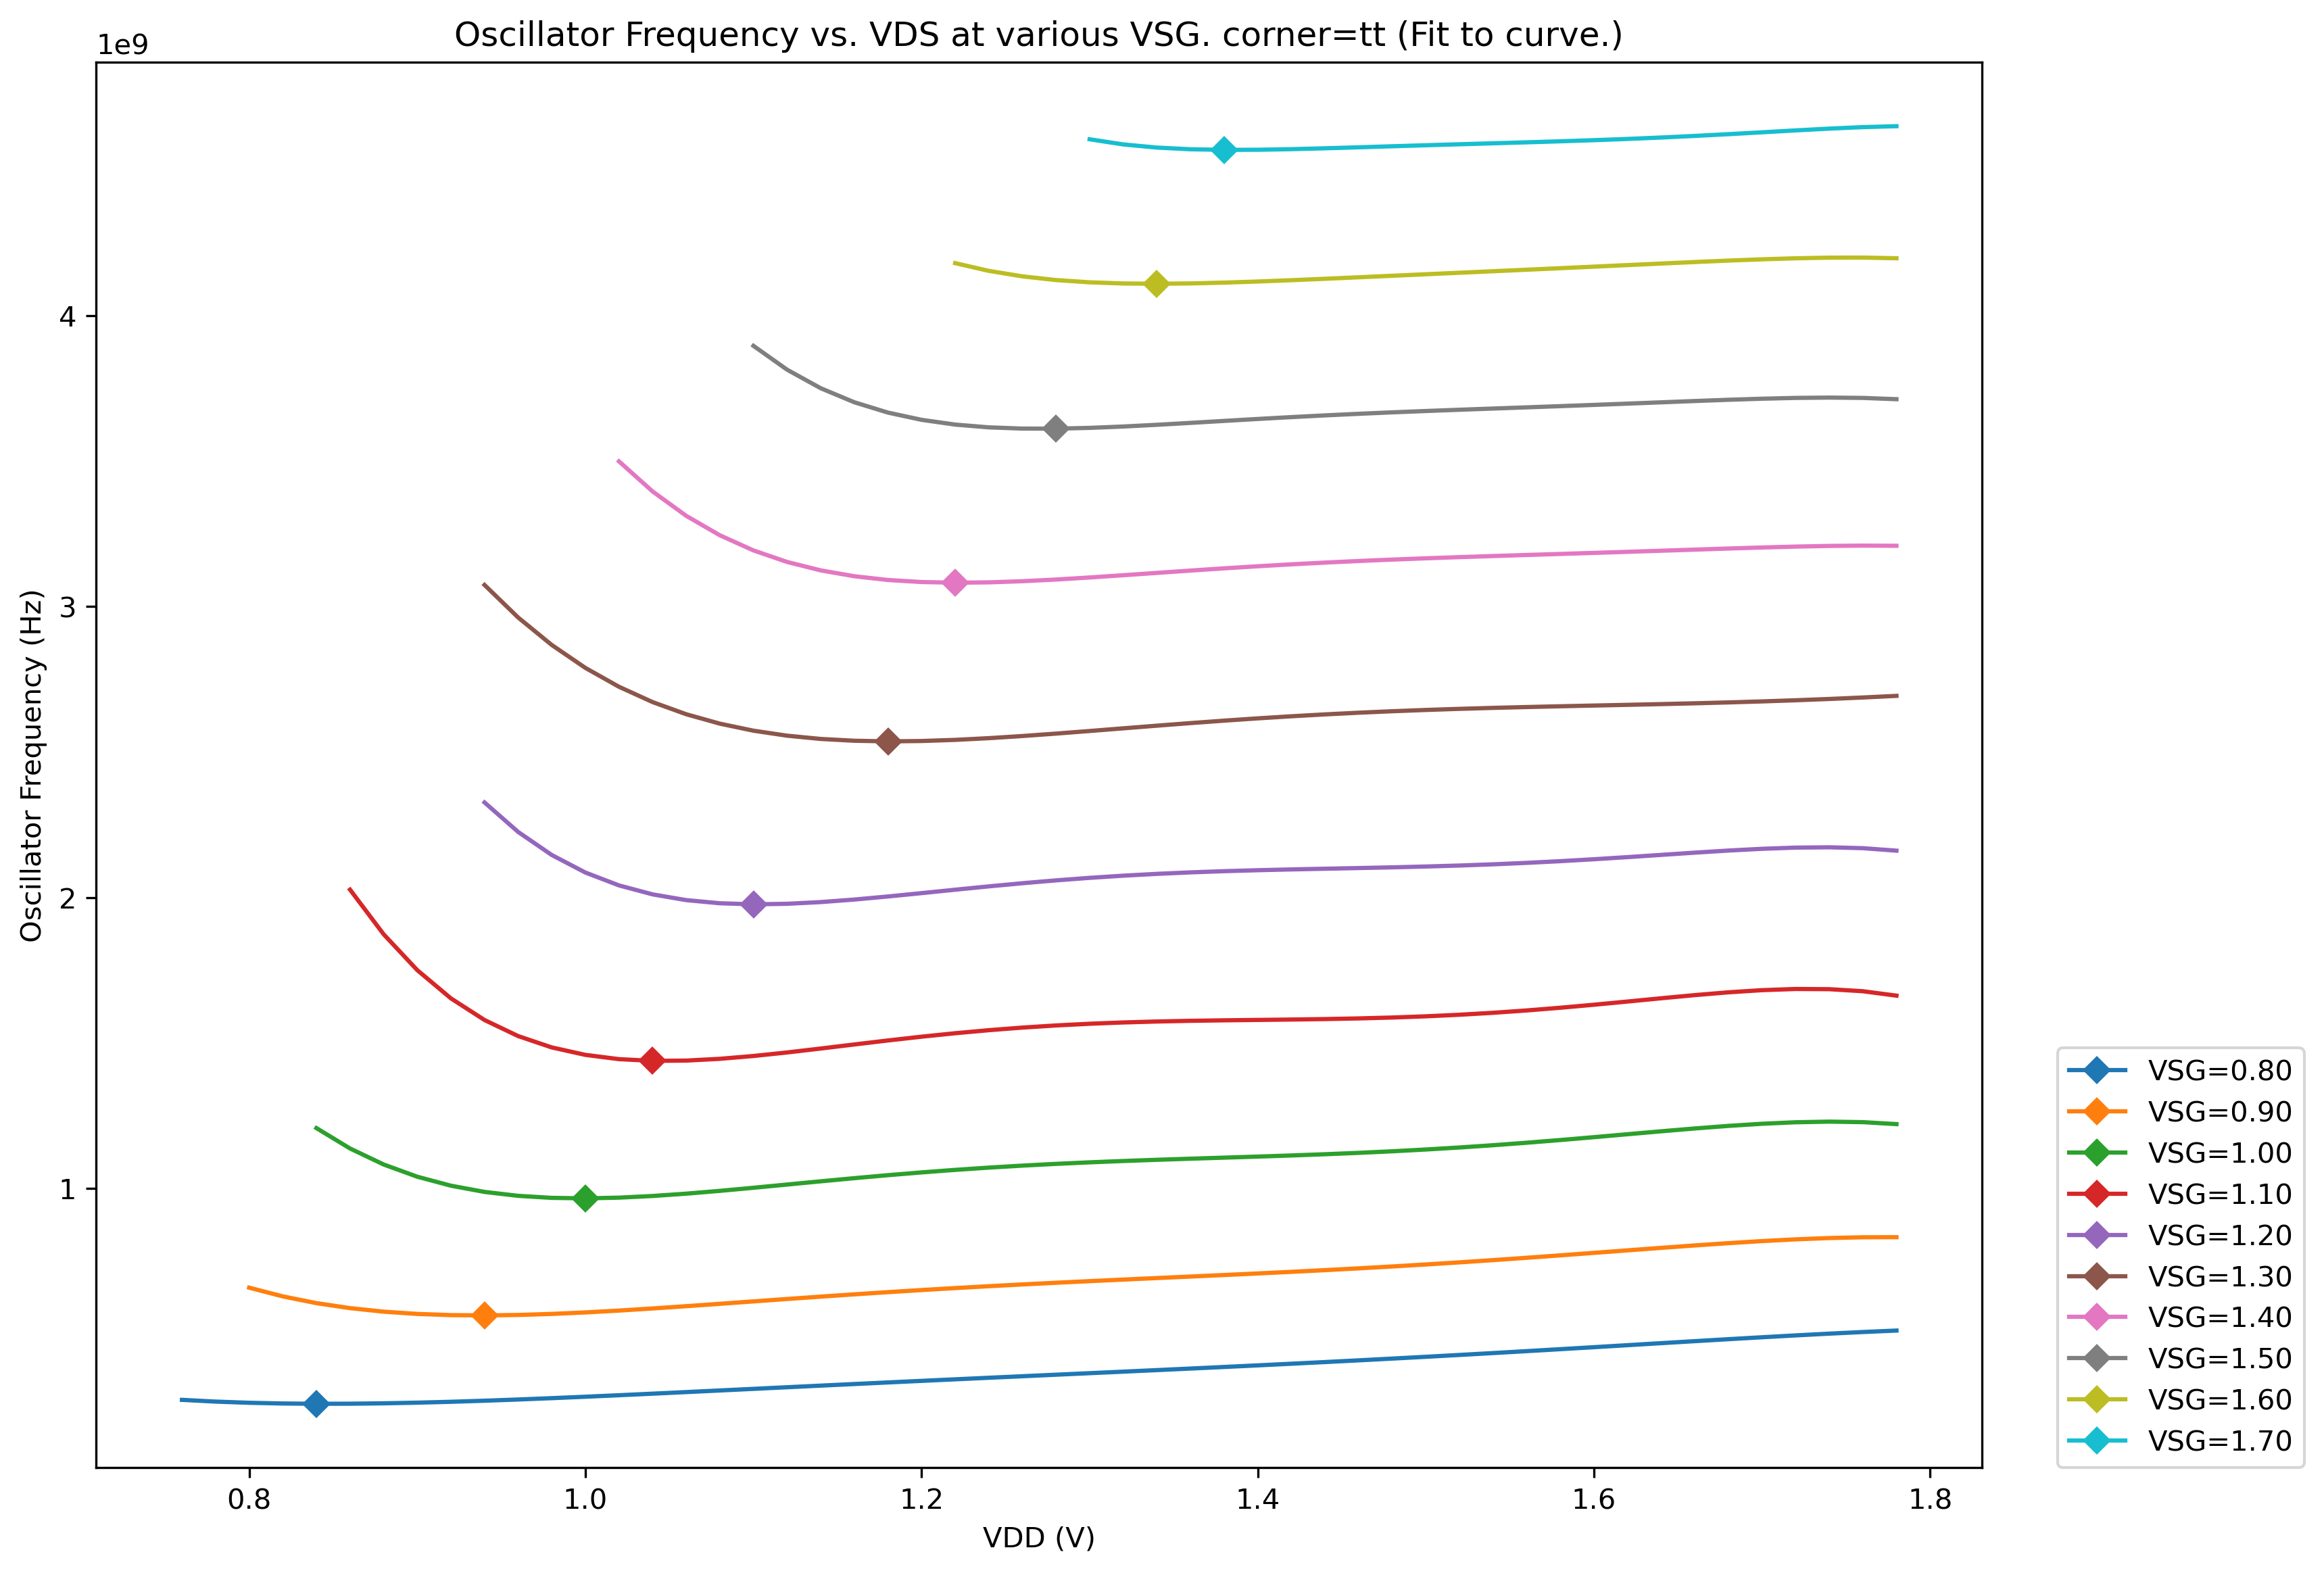
You can see that the lowest points are arranged in a linear trend. If simulations from all corners (TT, FF, SS, SF, FS) are done in the same way, the result is:
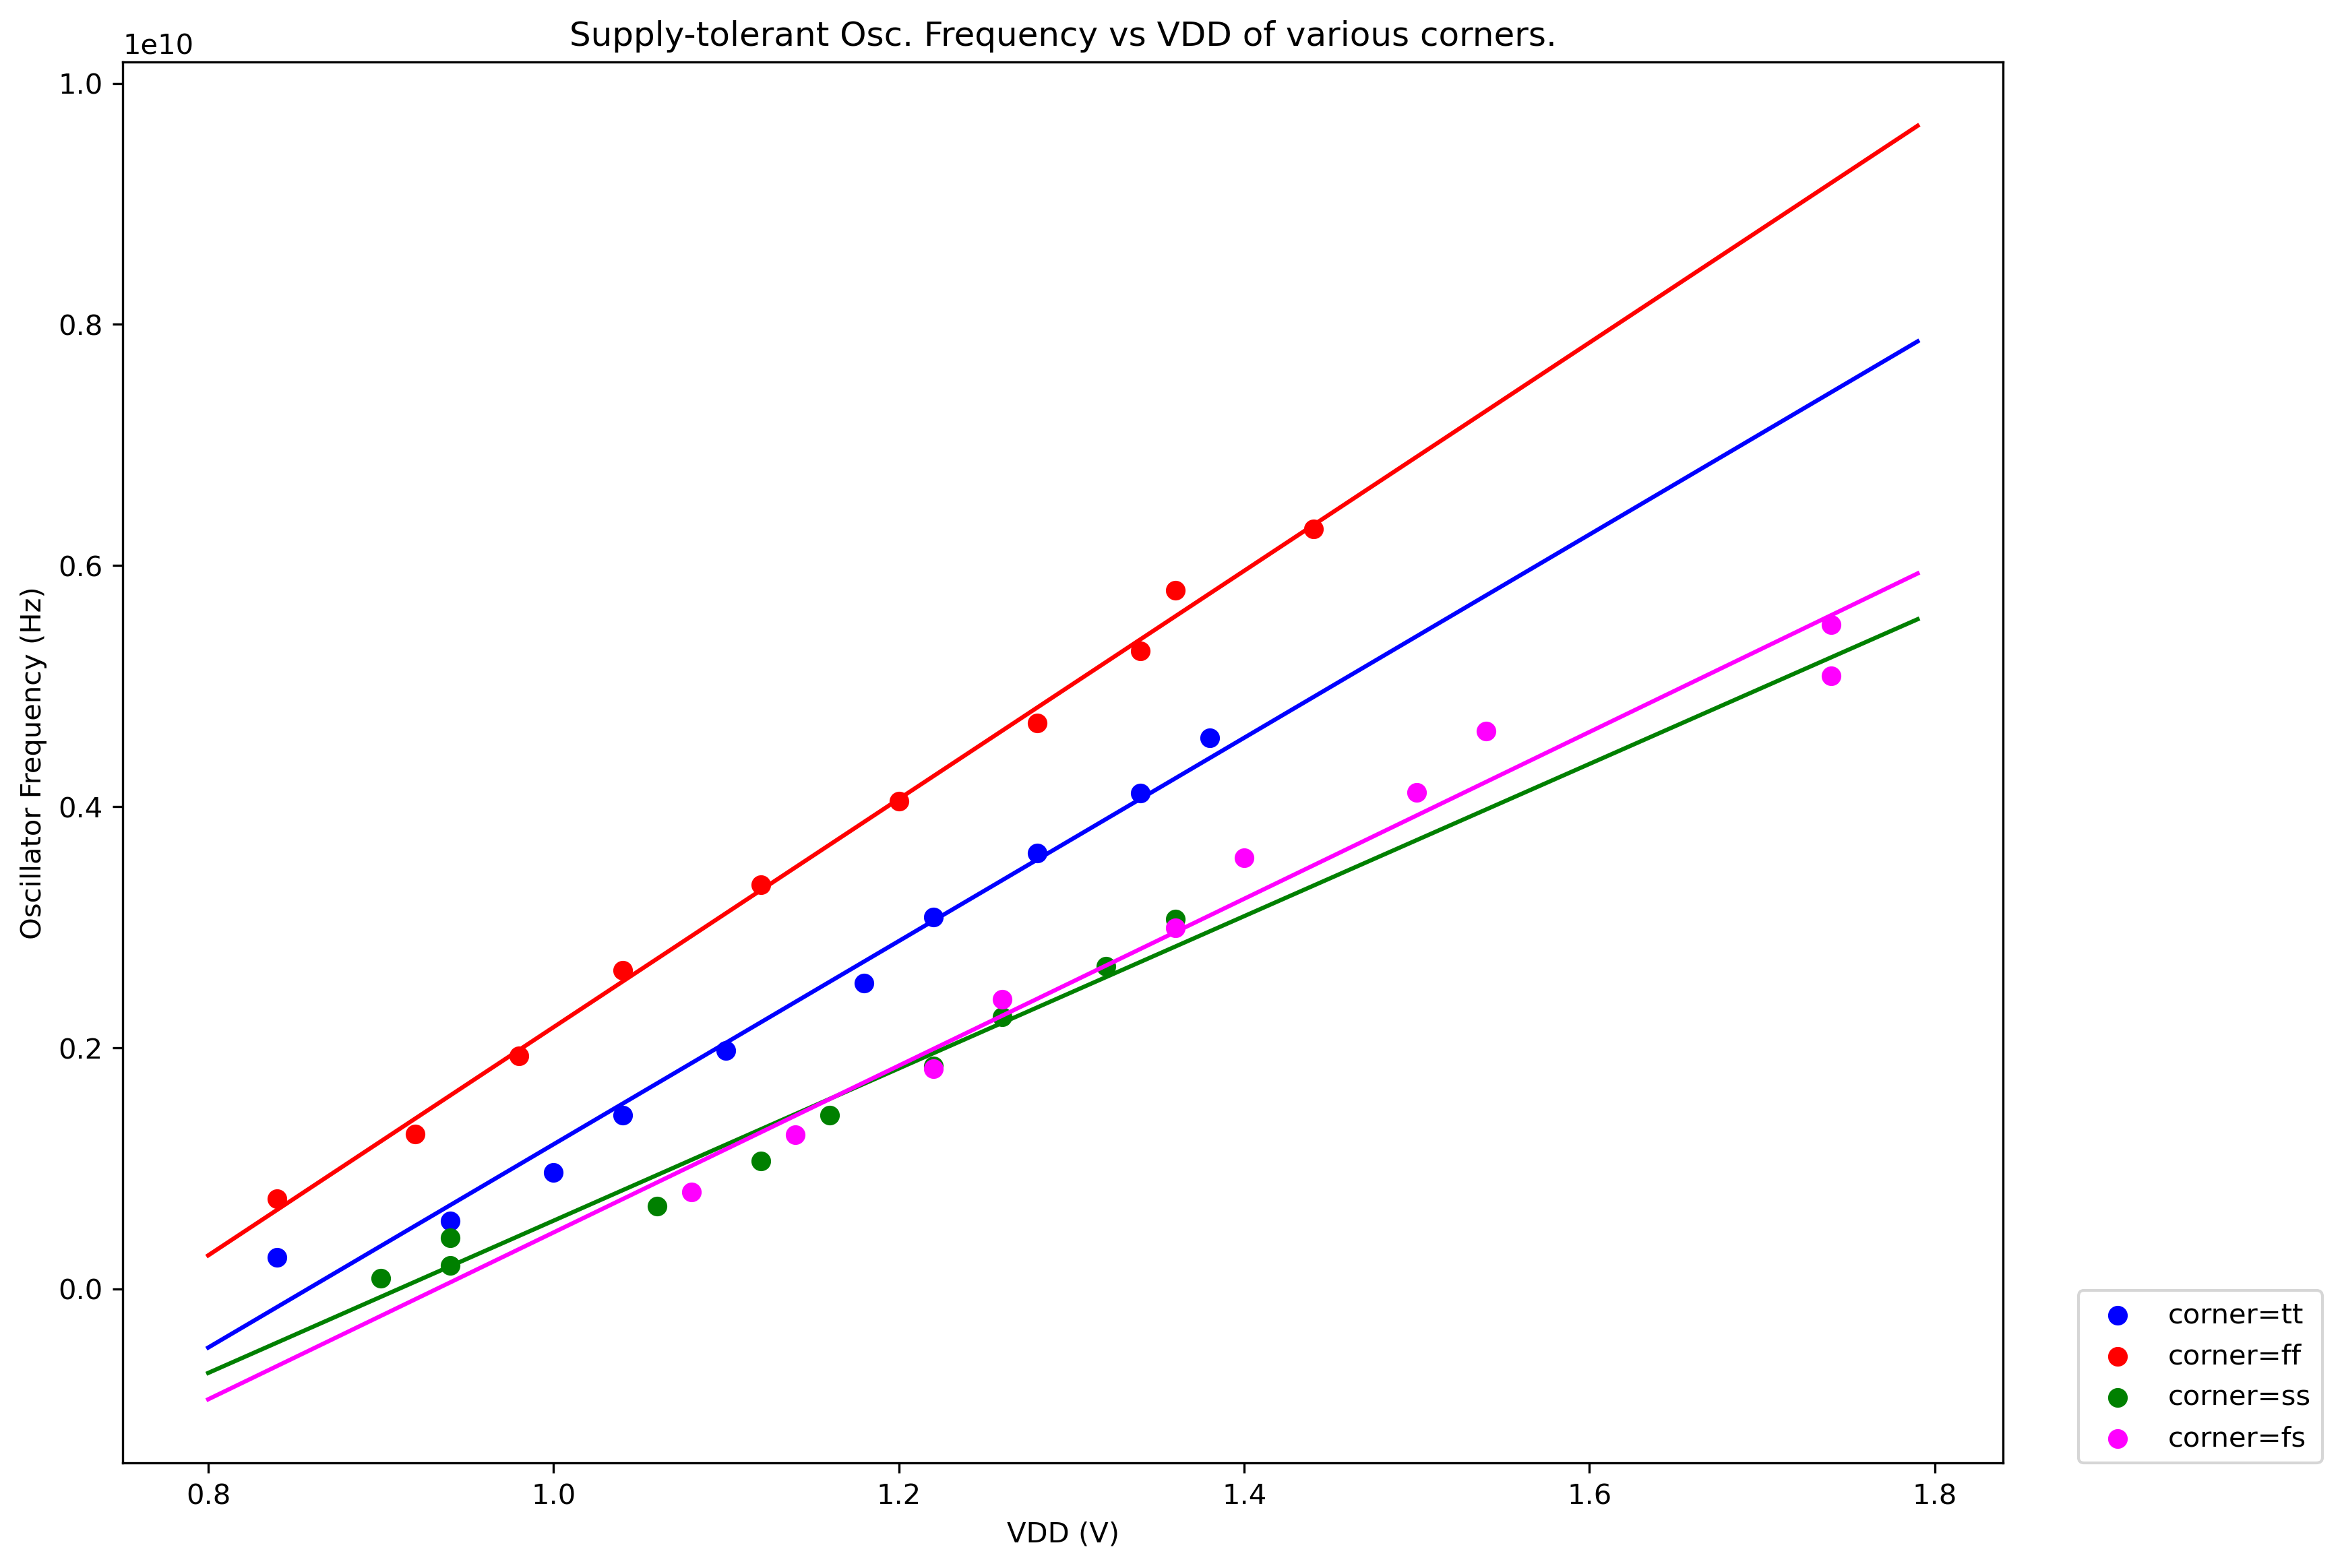
The result from the corner SF is not plotted because the trend is not linear anymore. (Maybe because the process in the paper is smaller than 130 nm?)
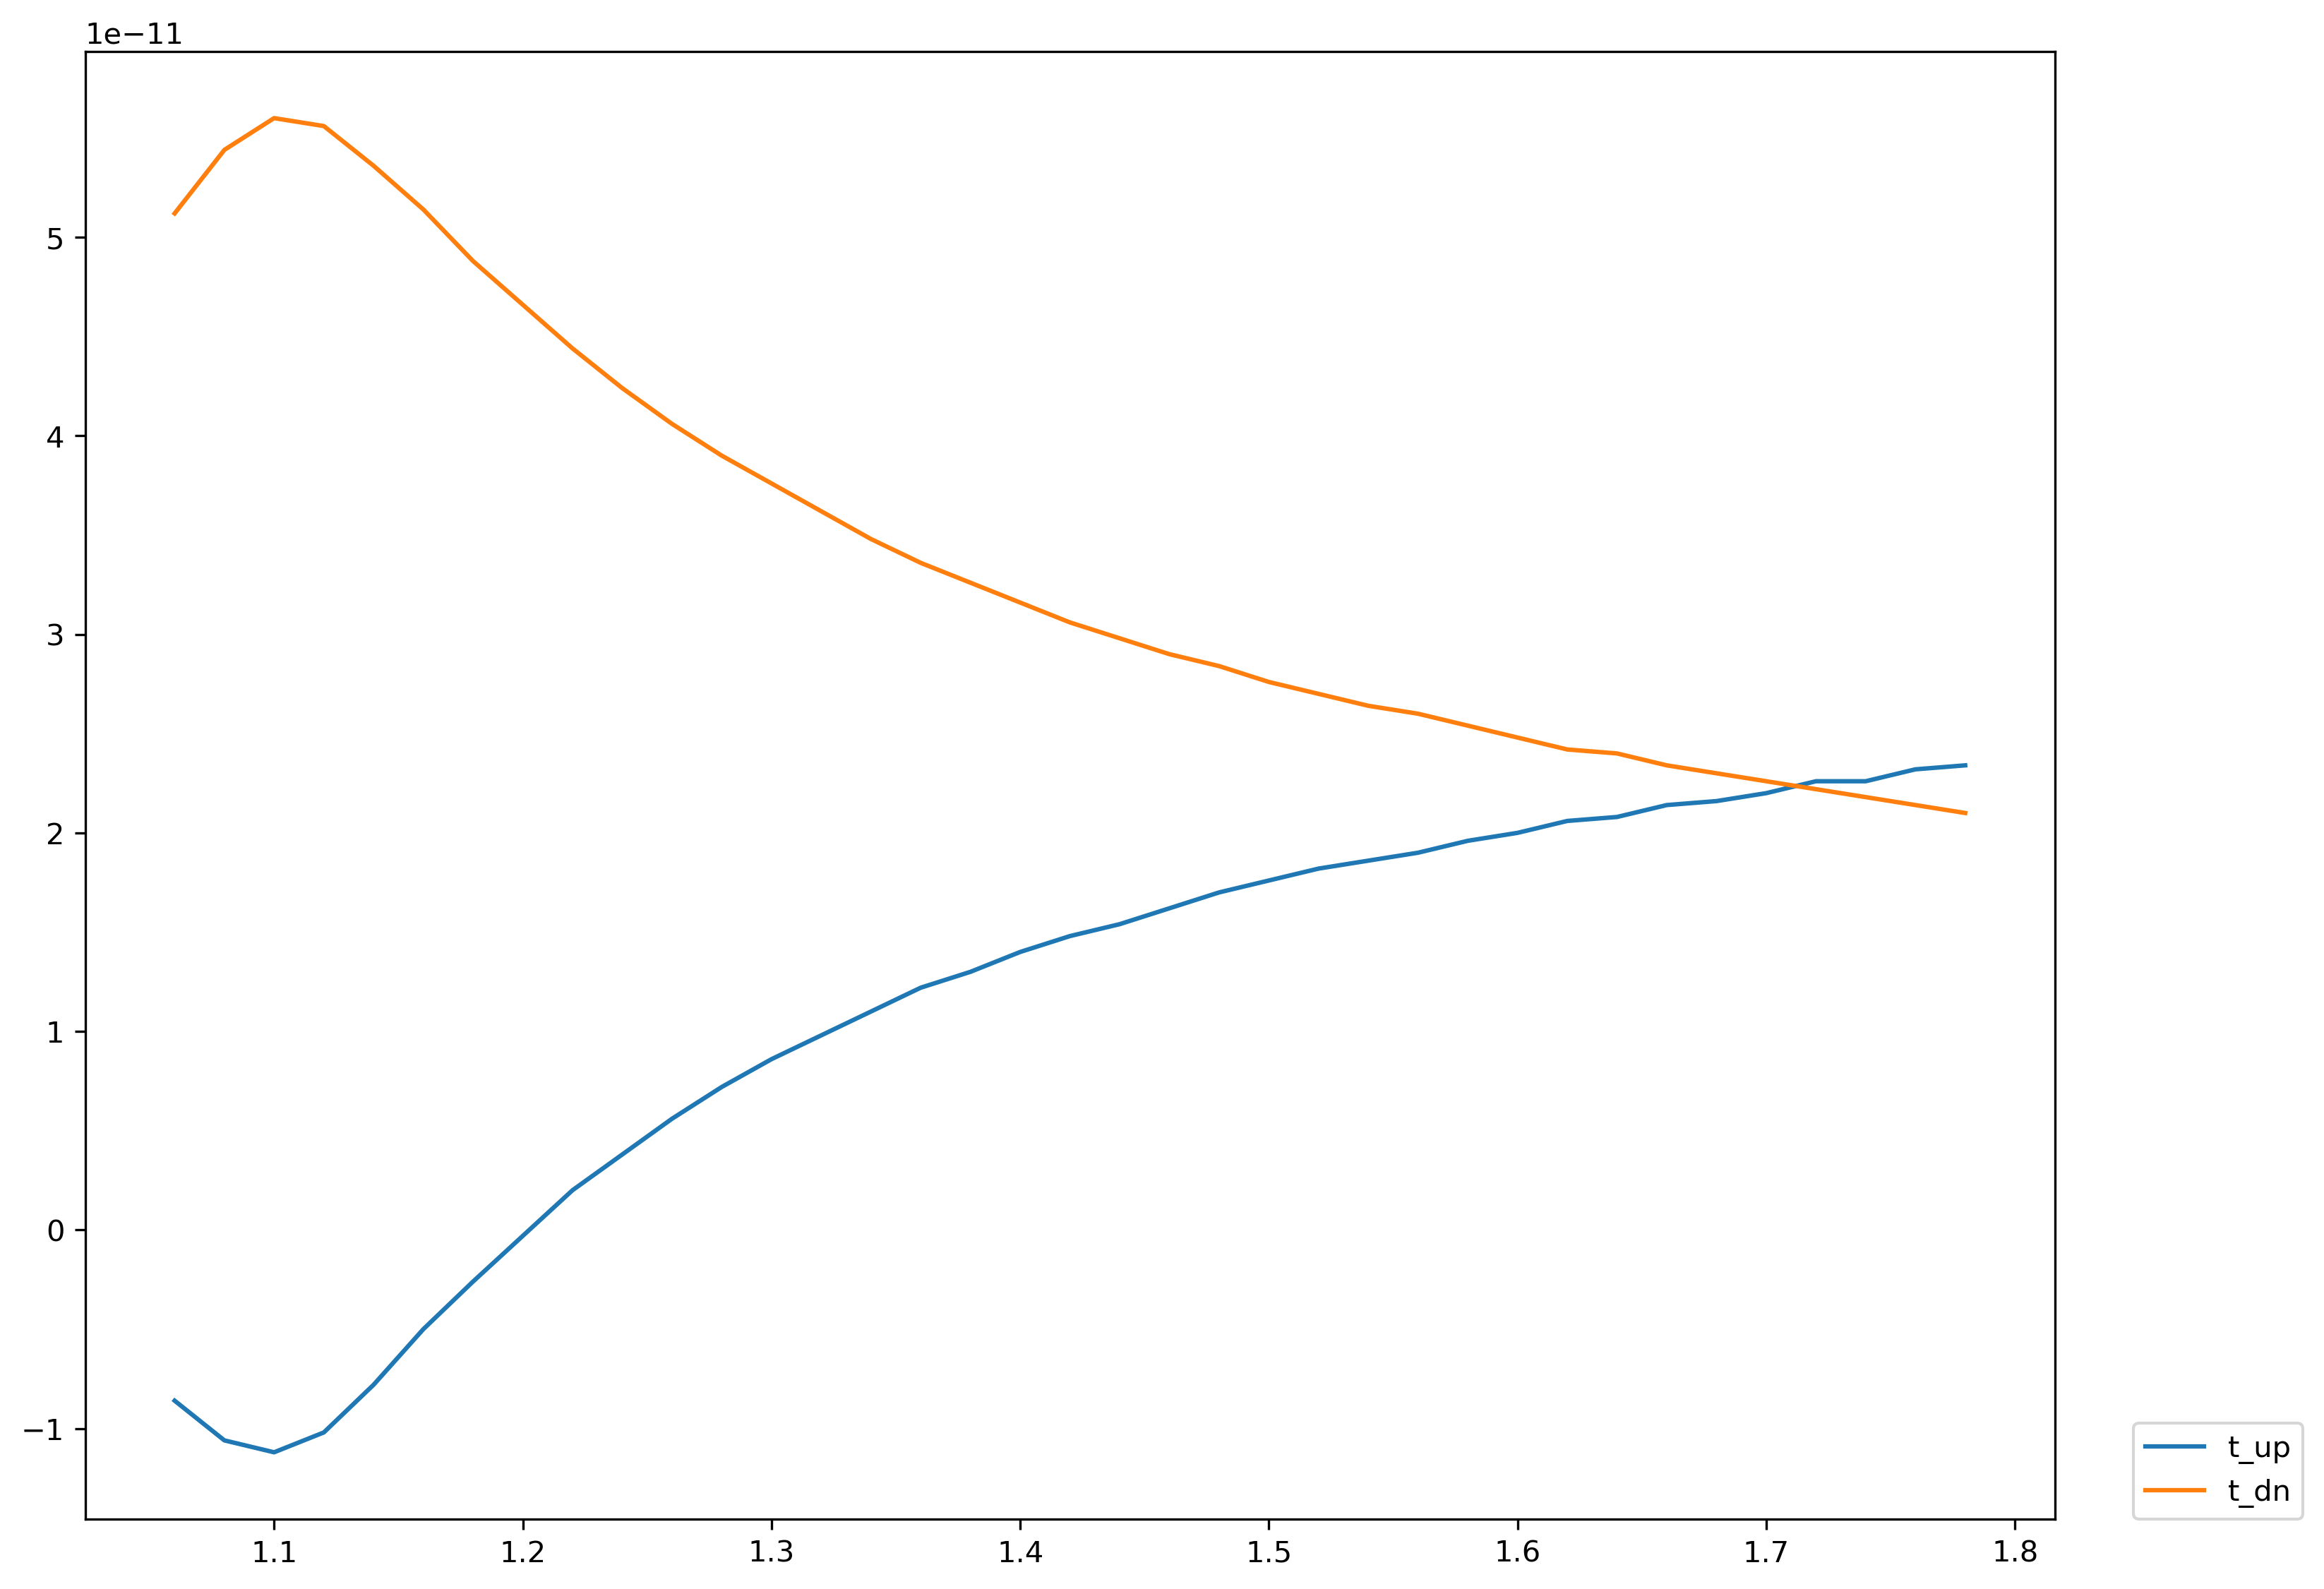
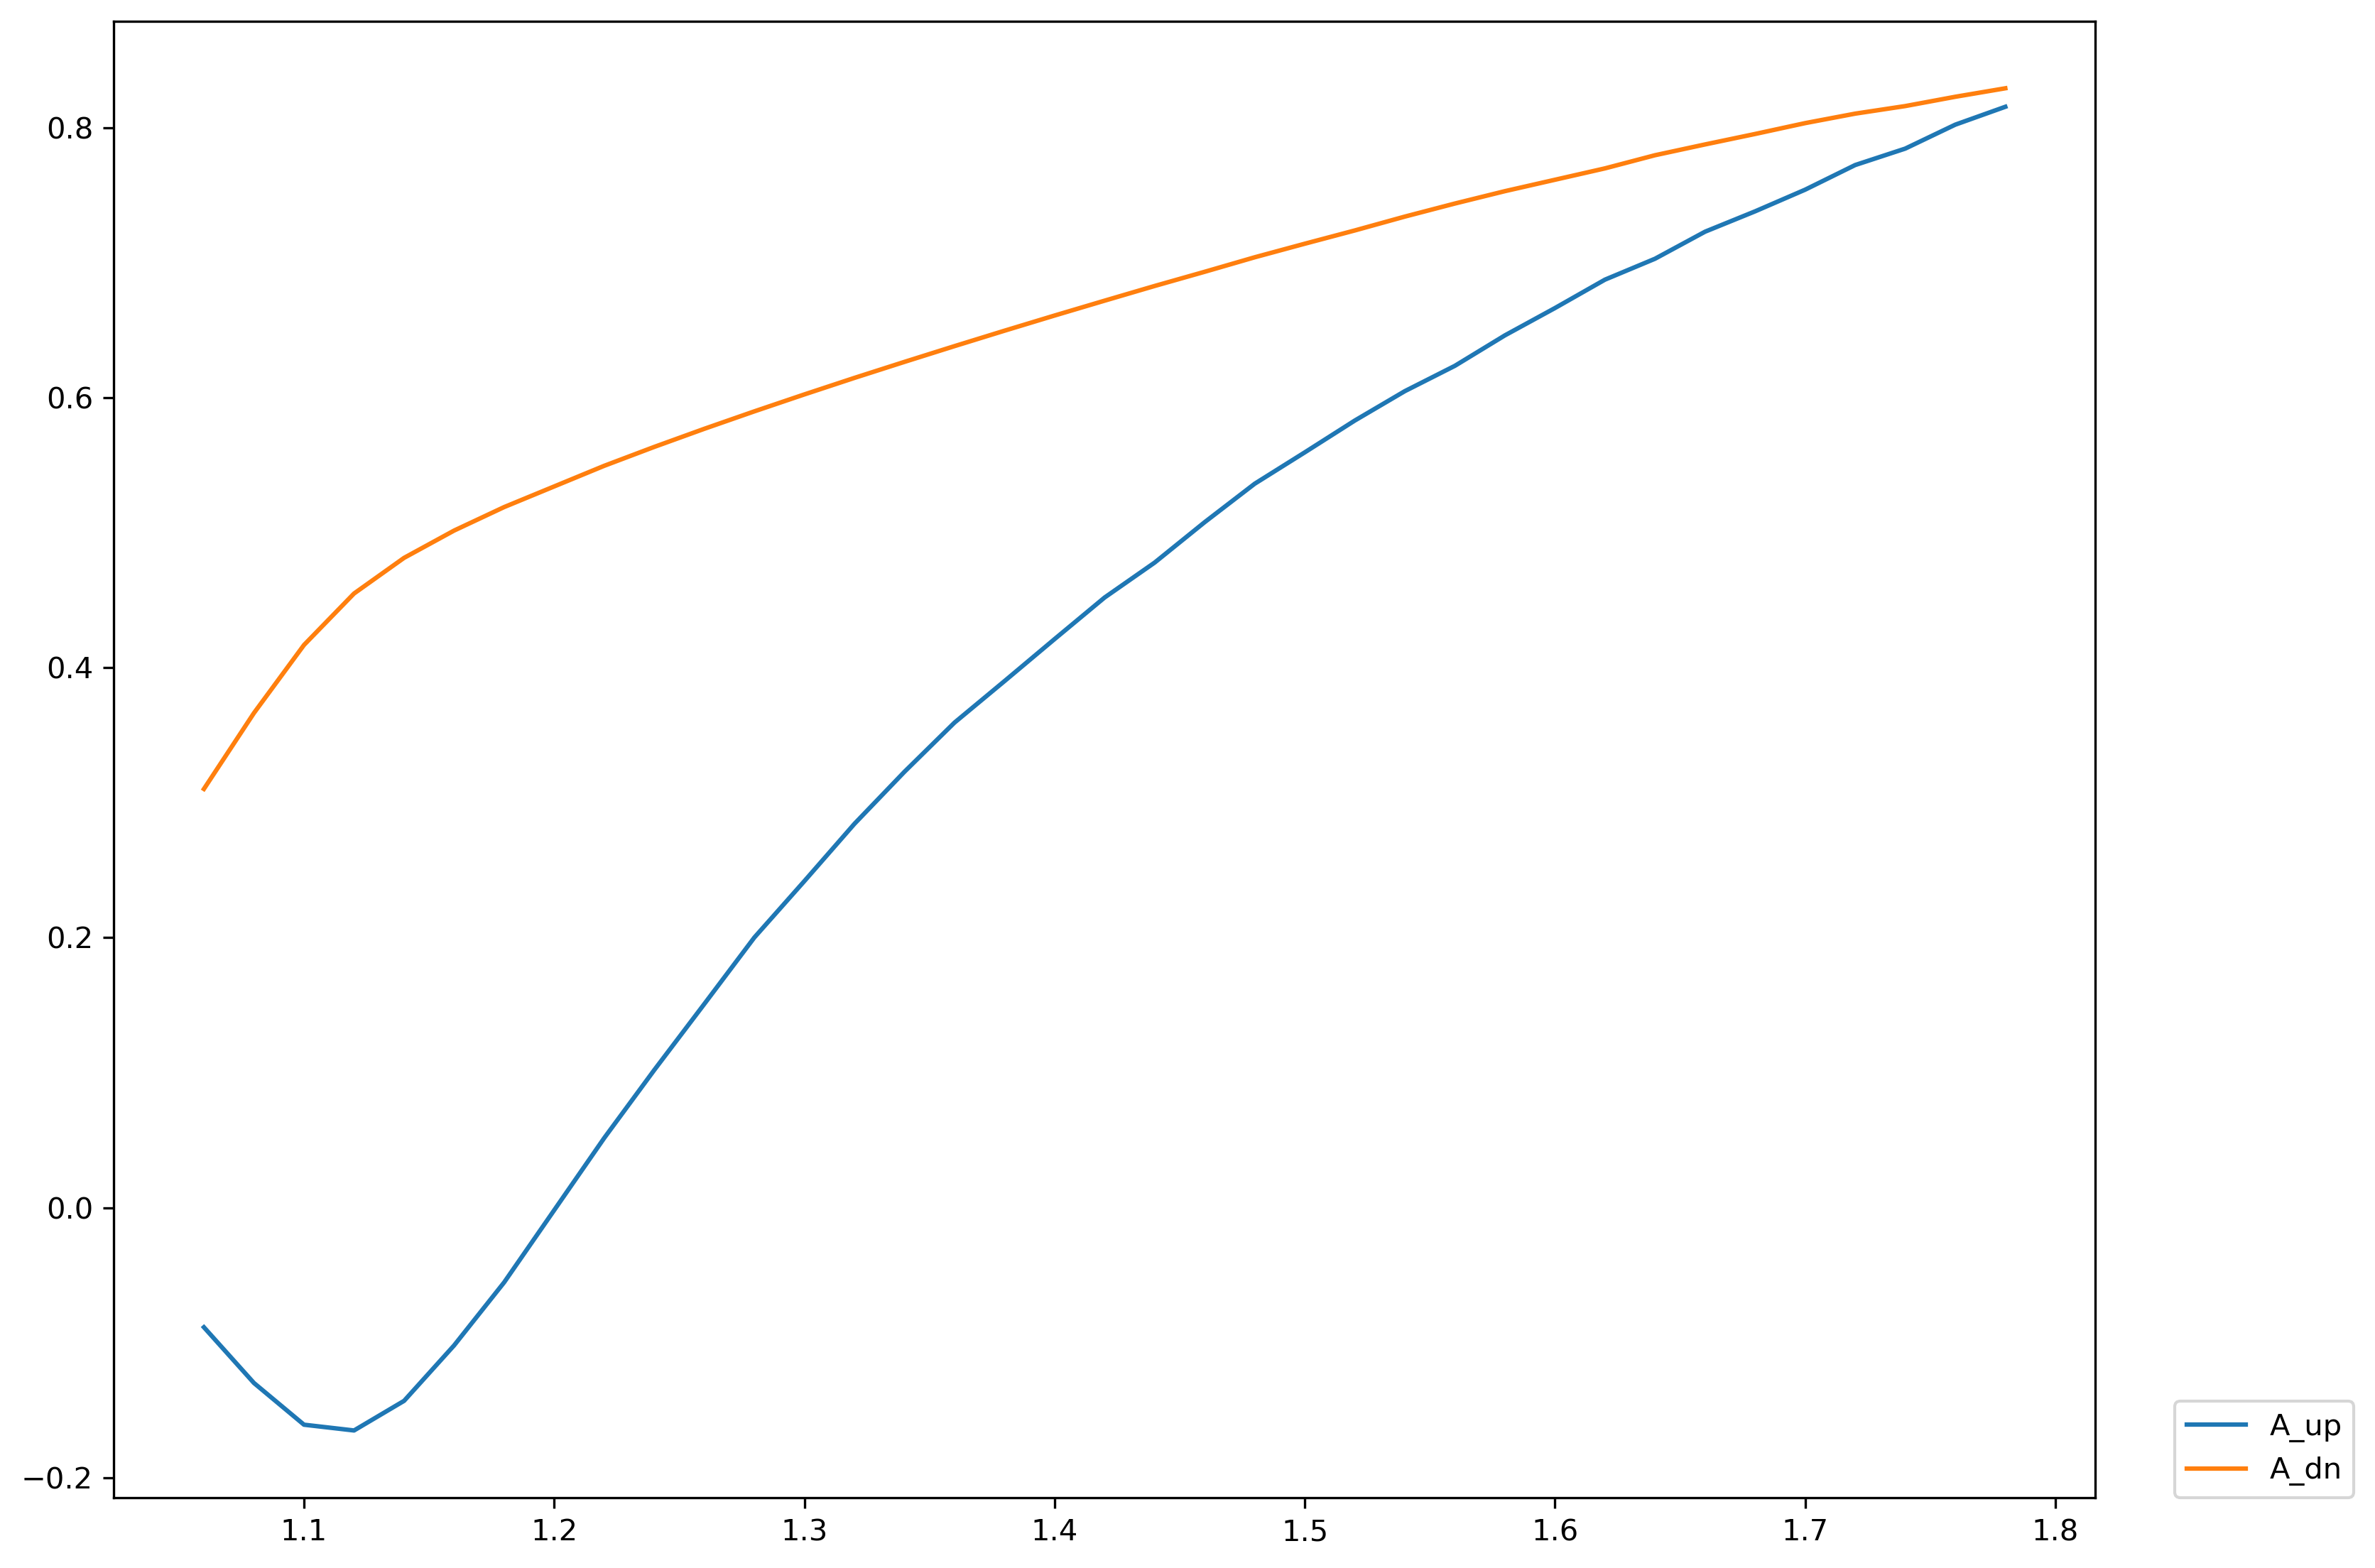
The t_up, t_down, A_up, and A_down in the paper can be measured in the same way:
# Code for Generating Plot Between
# Oscillator t_up, t_dn, A_up, A_dn vs. VDS at fixed VSG.
#
# 20 May 2023.
#
# By Nutchanon Jariyanurut and Makkawan Lohitsiri.

# Import required packages.
import PySpice.Logging.Logging as Logging
from PySpice.Spice.NgSpice.Shared import NgSpiceShared
from matplotlib import pyplot as plt
import numpy as np
import pandas as pd

# Setting the logger.
logger = Logging.setup_logging()

# Read the SPICE file.
f = open("vco_simple.spice","r")
lines = f.readlines()

# DataFrame to keep all data.
df = pd.DataFrame()

# Setting VSG.
VSG = 1.4

# List of VDD.
VDD_list = np.arange(1.04, 1.79, 0.02)

# List to keep data.
t_up_list = []
t_dn_list = []
A_up_list = []
A_dn_list = []

for VDD in VDD_list:

    # Initiate ngspice.
    ngspice = NgSpiceShared.new_instance()

    # Change the SPICE file to each corresponding experiment.
    circuit = ""
    for line in lines:
        if ".param VSG=" in line:
            line = f".param VSG={VSG:.2f}\n"
        if ".param VDD=" in line:
            line = f".param VDD={VDD:.2f}\n"
        circuit = "".join([circuit, line])

    # Load the SPICE file to ngspice.
    ngspice.load_circuit(circuit)

    # Run the simulation.
    ngspice.run()

    # Pull the experiment.
    plot = ngspice.plot(simulation=None, plot_name=ngspice.last_plot)

    # Pull the waveforms.
    analysis = plot.to_analysis()

    # Change the waveforms to NumPy array.
    v_in = np.array(analysis.vin)
    v_out = np.array(analysis.vout)
    v_time = np.array(analysis.vout.abscissa)

    # Time-series plot.
    plt.figure()
    plt.plot(v_time, v_in, label="V_in")
    plt.plot(v_time, v_out, label="V_out")
    plt.title(f"V_in and V_out waveforms vs. time\n when VDD={VDD:.2f} V and VSG={VSG:.2f} V")
    plt.xlabel("time (s)")
    plt.ylabel("voltage (V)")
    plt.legend(bbox_to_anchor=(1.04, 0), loc="lower left", borderaxespad=0)
    plt.savefig(f"osc_VSG={VSG:.2f}_VDD={VDD:.2f}.png", format="png", dpi=300, bbox_inches = 'tight')
    plt.close()

    # Calculate.
    v_max = (np.max(v_in) + np.max(v_out))/2
    v_min = (np.min(v_in) + np.min(v_out))/2
    v_avg = (v_max + v_min)/2
    v_in_norm = v_in - v_avg
    v_out_norm = v_out - v_avg

    # Calculate.
    in_down_change_idx = np.where(np.diff(np.sign(v_in_norm)) == -2)[0]
    out_up_change_idx = np.where(np.diff(np.sign(v_out_norm)) == 2)[0]
    in_up_change_idx = np.where(np.diff(np.sign(v_in_norm)) == 2)[0]
    out_down_change_idx = np.where(np.diff(np.sign(v_out_norm)) == -2)[0]

    try:
        # If the waveform has not less than 3 periods per simulation time, this can be run.
        in_period_idx = in_down_change_idx[-1] - in_down_change_idx[-2]
        in_down_time_idx = in_down_change_idx[2]
        out_up_time_idx = out_up_change_idx[out_up_change_idx > in_down_time_idx - in_period_idx/2][0]
        in_up_time_idx = in_up_change_idx[in_up_change_idx > in_down_time_idx][0]
        out_down_time_idx = out_down_change_idx[out_down_change_idx > in_up_time_idx - in_period_idx/2][0]

        in_down_time = v_time[in_down_time_idx]
        out_up_time = v_time[out_up_time_idx]
        in_up_time = v_time[in_up_time_idx]
        out_down_time = v_time[out_down_time_idx]

        t_up = out_up_time - in_down_time
        t_dn = out_down_time - in_up_time
        A_up = -v_out_norm[in_down_time_idx]
        A_dn = v_out_norm[in_up_time_idx]

        print(f"VSG={VSG:.2f}_VDD={VDD:.2f}")
        print(t_up, t_dn, A_up, A_dn)
    except:
        # If the waveform has less than 1 period per simulation time.
        t_up = 0
        t_dn = 0
        A_up = 0
        A_dn = 0

    # Save data.
    t_up_list.append(t_up)
    t_dn_list.append(t_dn)
    A_up_list.append(A_up)
    A_dn_list.append(A_dn)

    # Delete data in ngspice to prevent memory leakage.
    # (But memory leakage is still exist, anyway, so, please beware of OOM-killer in Linux.)
    ngspice.exec_command("destroy all")
    ngspice.exec_command("reset")

# Save df to csv.
df["t_up"] = t_up_list
df["t_dn"] = t_dn_list
df["A_up"] = A_up_list
df["A_dn"] = A_dn_list
df.to_csv("wave_chars.csv", encoding='utf-8')

# After the csv is generated, data cleaning (manually) is required.
The result can be plotted using Python after cleaning up some data.